


我是如何用python炒股3个月赚到320万的
由于老鸟并无深厚的数学功底也无深厚的金融知识, 所以不会在本文中引用各种高深的投资模型或数学模型,参考书籍主要是《海龟交易法则》《以交易为生》。
交易系统
在交易之前,我们应该首先有一个交易系统用于指导我们自己交易,不一定有什么规范,但是可以作为一个交易的依据,至于这个依据可不可行,科不科学那就见仁见智了。
当然了,这里的交易系统不一定是程序,只是指你自己的交易原则或者遵守的一些技巧或者方法,你可以手动执行也可以借助编程语言,编程语言不就是一套用来使用的工具么.
这里参考海龟交易法则里面的交易体系(这里只是参考大方向).
建立一个完善的交易体系,我们至少应该思考一下六个方面。
- 1、市场----买卖什么
- 2、头寸规模----买卖多少
- 3、入市----何时买入
- 4、止损----何时退出亏损的头寸
- 5、止盈----何时退出盈利的头寸
- 6、离市----何时离市
简单的示例
- 买卖A股
- 全仓
- 当日涨幅超过3%买入。
- 当持有头寸亏损超过3%,平仓
- 当日跌幅大于3%或者三个连续阴线
分析: 这个交易策略其实只有在行情以波浪形状向上的行情时候才能获利,如果是盘整的情况下,怕是会亏的很惨。这里之所以写的这么简单粗暴是为了后面策略测试撸代码简单。
数据获取及处理
因为这里说的是用python炒股,所以应该采用程序的方式去获取数据,如果人工炒股,下载任何股票行情软件都是可以的,但是人工的执行是需要花费比较多的精力的。
而python语言中用于获取股票行情数据的库,最有名莫过于tushare了。
这里以上证乐视的股票为例吧。
python环境安装
安装Anaconda(python2版本)下载地址:https://www.anaconda.com/download/
注:如果没安装过这个环境的经验,就百度或者谷歌一下吧,如果不是安装anaconda则需要艰难的自行解决依赖。
安装tushare
pip install tushare获取行情数据
import pandas as pd
import tushare as ts

# 通过股票代码获取股票数据,这里没有指定开始及结束日期
df = ts.get_k_data("300104")

# 查看前十条数据
df.head()

# 查看后十条数据
df.tail()

# 将数据的index转换成date字段对应的日期
df.index = pd.to_datetime(df.date)

# 将多余的date字段删除
df.drop("date", inplace=True, axis=1)
注:关于股票数据的相关处理需要由pandas,matplotlib的知识,参考:http://pandas.pydata.org/pandas-docs/version/0.20/10min.html
计算常用指标
# 计算5,15,50日的移动平均线, MA5, MA15, MA50
days = [5, 15, 50]
for ma in days:
    column_name = "MA{}".format(ma)
    df[column_name] = pd.rolling_mean(df.close, ma)

# 计算浮动比例
df["pchange"] = df.close.pct_change()
# 计算浮动点数
df["change"] = df.close.diff()
df.head()
最终处理完成后的结果如下:
Out[13]:
open close high low volume code MA5 MA15 MA50 \
date
2013-11-29 9.396 9.741 9.870 9.389 146587.0 300104 NaN NaN NaN
2013-12-02 9.298 8.768 9.344 8.768 177127.0 300104 NaN NaN NaN
2013-12-03 8.142 8.414 8.546 7.890 176305.0 300104 NaN NaN NaN
2013-12-04 8.391 8.072 8.607 8.053 120115.0 300104 NaN NaN NaN
2013-12-05 7.983 7.366 8.108 7.280 253764.0 300104 8.4722 NaN NaN

pchange change
date
2013-11-29 NaN NaN
2013-12-02 -0.099887 -0.973
2013-12-03 -0.040374 -0.354
2013-12-04 -0.040647 -0.342
可视化
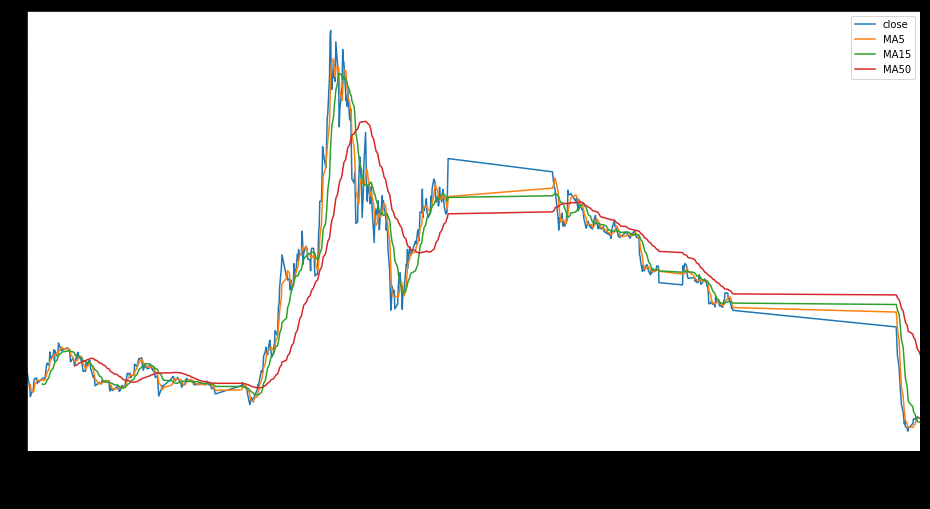
走势图
所谓一图胜前言,将数据可视化可以非常直观的感受到股票的走势。
个人觉得,如果用程序炒股还是应该一切都量化的,不应该有过多的主观观点,如果过于依赖直觉或者当时心情,那么实在没必要用程序分析了。
df[["close", "MA5", "MA15", "MA50"]].plot(figsiz=(10,18))
效果如下:
k线图
import matplotplib.pyplot as plt
from matplotlib.daet import DateFormatter
from matplotlib.finance import date2num, candlestick_ohlc

def candlePlot(data, title=""):
    data["date"] = [date2num(pd.to_datetime(x)) for x in data.index]
    dataList = [tuple(x) for x in data[["date", "open", "high", "low", "close"]].values]

    ax = plt.subplot()
    ax.set_title(title)
    ax.xaxis.set_major_formatter(DateFormatter("%y-%m-%d"))
    candlestick_ohlc(ax, dataList, width=0.7, colorup="r", colordown="g")
    plt.setp(plt.gca().get_xticklabels(), rotation=50,
    horizontalalignment="center")
    fig = plt.gcf()
    fig.set_size_inches(20, 15)
    plt.grid(True)

    candlePlot(df)
效果如下:
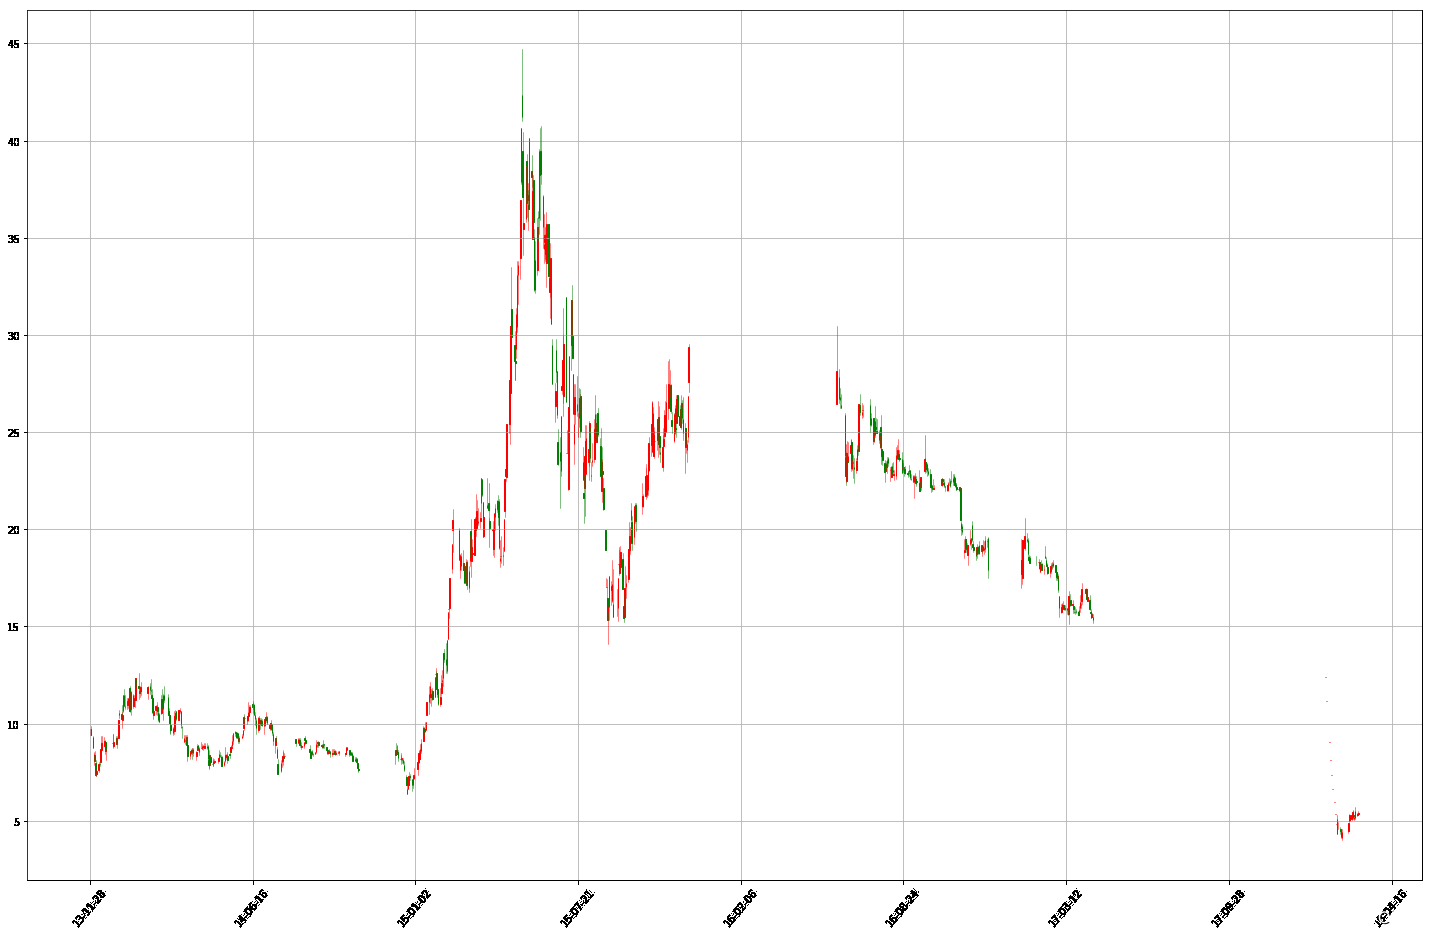
注: 这里只是一个示例,说明matplotlib的强大以及小小的演示,如果遇到什么奇怪的问题就查api或者google吧。
策略测试
手动撸代码
这里用最近买过的一只股票吧,京东方A(000725)。
# 导入相关模块
import tushare as ts
import pandas as pd

# 获取数据
df = ts.get_k_data("000725")
# 处理数据
df.index = pd.to_datetime(df.date)
df.drop("date", axis=1, inplace=True)
# 计算浮动比例
df["pchange"] = df.close.pct_change()
# 计算浮动点数
df["change"] = df.close.diff()
# 设定回撤值
withdraw = 0.03
# 设定突破值
breakthrough = 0.03
# 设定账户资金
account = 10000
# 持有仓位手数
position = 0

def buy(bar):
    global account, position
    print("{}: buy {}".format(bar.date, bar.close))
    # 一手价格
    one = bar.close * 100
    position = account // one
    account = account - (position * one)

def sell(bar):
    global account, position
    # 一手价格
    print("{}: sell {}".format(bar.date, bar.close))
    one = bar.close * 100
    account += position * one
    position = 0

    print("开始时间投资时间: ", df.iloc[0].date)
    for date in df.index:
        bar = df.loc[date]
        if bar.pchange and bar.pchange > breakthrough and position == 0:
            buy(bar)
        elif bar.pchange and bar.pchange < withdraw and position > 0:
            sell(bar)

    print("最终可有现金: ", account)
    print("最终持有市值: ", position * df.iloc[-1].close * 100)
输出如下:
开始时间投资时间:  2015-07-20
2015-07-29: buy 3.83
2015-07-30: sell 3.653
2015-08-04: buy 3.752
......
2018-02-27: sell 5.71
2018-03-06: buy 5.79
最终可有现金:  333.3
最终持有市值:  7527.0
结论: 通过上面的测试发现资亏了两千多...
借助测试框架
借助测试框架才是正确的回撤姿势,因为框架包含了更多的功能。这里使用pyalgotrade。
简单使用
from pyalgotrade import strategy
from pyalgotrade import technical
from pyalgotrade.barfeed import yahoofeed

# 自定义事件窗口类
class DiffEventWindow(technical.EventWindow):
    def __init__(self, period):
        assert(period > 0)
        super(DiffEventWindow, self).__init__(period)
        self.__value = None

    def onNewValue(self, dateTime, value):
        super(DiffEventWindow, self).onNewValue(dateTime, value)
        if self.windowFull():
            lastValue = self.getValues()[0]
            nowValue = self.getValues()[1]
        self.__value = (nowValue - lastValue) / lastValue

    def getValue(self):
        return self.__value

# 自定义指标
class Diff(technical.EventBasedFilter):
    def __init__(self, dataSeries, period, maxLen=None):
        super(Diff, self).__init__(dataSeries, DiffEventWindow(period), maxLen)

# 定义自己的策略
class MyStrategy(strategy.BacktestingStrategy):
    def __init__(self, feed, instrument, diffPeriod=2):
        # 传入feed及初始账户资金
        super(MyStrategy, self).__init__(feed, 10000)
        self.__instrument = instrument
        self.__position = None
        self.setUseAdjustedValues(True)
        self.__prices = feed[instrument].getPriceDataSeries()
        self.__diff = Diff(self.__prices, diffPeriod)
        self.__break = 0.03
        self.__withdown = -0.03

    def getDiff(self):
        return self.__diff

    def onEnterCanceled(self, position):
        self.__position = None

    def onEnterOk(self, position):
        execInfo = position.getEntryOrder().getExecutionInfo()
        self.info("BUY at $%.2f" % (execInfo.getPrice()))

    def onExitOk(self, position):
        execInfo = position.getExitOrder().getExecutionInfo()
        self.info("SELL at $%.2f" % (execInfo.getPrice()))
        self.__position = None

    def onExitCanceled(self, position):
        # If the exit was canceled, re-submit it.
        self.__position.exitMarket()

    def onBars(self, bars):
        account = self.getBroker().getCash()
        bar = bars[self.__instrument]
        if self.__position is None:
            one = bar.getPrice() * 100
            oneUnit = account // one
        if oneUnit > 0 and self.__diff[-1] > self.__break:
            self.__position = self.enterLong(self.__instrument, oneUnit * 100, True)
        elif self.__diff[-1] < self.__withdown and not self.__position.exitActive():
            self.__position.exitMarket()

def runStrategy():
# 下载数据
jdf = ts.get_k_data("000725")

# 新建Adj Close字段
jdf["Adj Close"] =jdf.close

# 将tushare下的数据的字段保存为pyalgotrade所要求的数据格式
jdf.columns = ["Date", "Open", "Close", "High", "Low", "Volume", "code",
"Adj Close"]

# 将数据保存成本地csv文件
jdf.to_csv("jdf.csv", index=False)

feed = yahoofeed.Feed()
feed.addBarsFromCSV("jdf", "jdf.csv")

myStrategy = MyStrategy(feed, "jdf")

myStrategy.run()
print("Final portfolio value: $%.2f" % myStrategy.getResult())

runStrategy()
输出如下
2015-07-30 00:00:00 strategy [INFO] BUY at $3.78
2015-07-31 00:00:00 strategy [INFO] SELL at $3.57
2015-08-05 00:00:00 strategy [INFO] BUY at $3.73
2015-08-06 00:00:00 strategy [INFO] SELL at $3.56
...
2018-02-13 00:00:00 strategy [INFO] BUY at $5.45
Final portfolio value: $7877.30
猛地一看会发现,用框架似乎写了更多的代码,但是框架内置了更多分析工具。
下面简单介绍。
策略可视化
from pyalgotrade import strategy
from pyalgotrade import technical
from pyalgotrade.barfeed import yahoofeed
from pyalgotrade import plotter
from pyalgotrade.stratanalyzer import returns

class DiffEventWindow(technical.EventWindow):
    def __init__(self, period):
        assert(period > 0)
        super(DiffEventWindow, self).__init__(period)
        self.__value = None

    def onNewValue(self, dateTime, value):
        super(DiffEventWindow, self).onNewValue(dateTime, value)
        if self.windowFull():
            lastValue = self.getValues()[0]
            nowValue = self.getValues()[1]
            self.__value = (nowValue - lastValue) / lastValue

    def getValue(self):
        return self.__value

class Diff(technical.EventBasedFilter):
    def __init__(self, dataSeries, period, maxLen=None):
        super(Diff, self).__init__(dataSeries, DiffEventWindow(period), maxLen)

class MyStrategy(strategy.BacktestingStrategy):
    def __init__(self, feed, instrument, diffPeriod=2):
        super(MyStrategy, self).__init__(feed, 10000)
        self.__instrument = instrument
        self.__position = None
        self.setUseAdjustedValues(True)
        self.__prices = feed[instrument].getPriceDataSeries()
        self.__diff = Diff(self.__prices, diffPeriod)
        self.__break = 0.03
        self.__withdown = -0.03

    def getDiff(self):
        return self.__diff

    def onEnterCanceled(self, position):
        self.__position = None

    def onEnterOk(self, position):
        execInfo = position.getEntryOrder().getExecutionInfo()
        self.info("BUY at $%.2f" % (execInfo.getPrice()))

    def onExitOk(self, position):
        execInfo = position.getExitOrder().getExecutionInfo()
        self.info("SELL at $%.2f" % (execInfo.getPrice()))
        self.__position = None

    def onExitCanceled(self, position):
        # If the exit was canceled, re-submit it.
        self.__position.exitMarket()

    def onBars(self, bars):
        account = self.getBroker().getCash()
        bar = bars[self.__instrument]
        if self.__position is None:
            one = bar.getPrice() * 100
            oneUnit = account // one
        if oneUnit > 0 and self.__diff[-1] > self.__break:
            self.__position = self.enterLong(self.__instrument, oneUnit * 100, True)
        elif self.__diff[-1] < self.__withdown and not self.__position.exitActive():
            self.__position.exitMarket()

def runStrategy():
# 下载数据
jdf = ts.get_k_data("000725")

# 新建Adj Close字段
jdf["Adj Close"] =jdf.close

# 将tushare下的数据的字段保存为pyalgotrade所要求的数据格式
jdf.columns = ["Date", "Open", "Close", "High", "Low", "Volume", "code",
"Adj Close"]

# 将数据保存成本地csv文件
jdf.to_csv("jdf.csv", index=False)

feed = yahoofeed.Feed()
feed.addBarsFromCSV("jdf", "jdf.csv")

myStrategy = MyStrategy(feed, "jdf")

returnsAnalyzer = returns.Returns()
myStrategy.attachAnalyzer(returnsAnalyzer)
plt = plotter.StrategyPlotter(myStrategy)
plt.getInstrumentSubplot("jdf")
plt.getOrCreateSubplot("returns").addDataSeries("Simple returns",
returnsAnalyzer.getReturns())

myStrategy.run()
print("Final portfolio value: $%.2f" % myStrategy.getResult())
plt.plot()

runStrategy()
图片输出如下
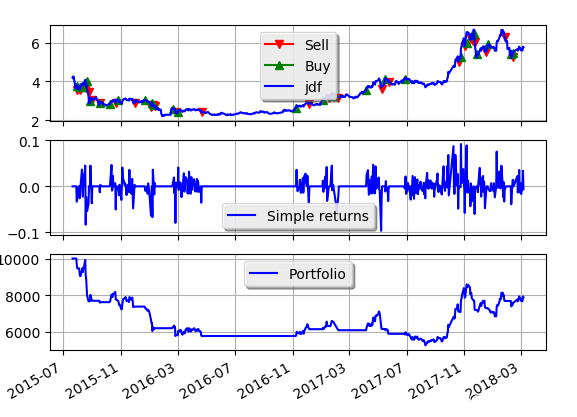
注: 这里的策略测试股票选择以及时间选择并不严谨,仅作功能展示,测试结果可能有很大的巧合性。Pyalgotrade详细介绍皆使用参考:http://gbeced.github.io/pyalgotrade/docs/v0.18/html/index.html
上述源代码:https://github.com/youerning/blog/blob/master/python-trade/demo.py
股价监控
根据这个需求写了一个股价监控的半成品,通过邮箱监控。
项目参考: https://github.com/youerning/UserPyScript/tree/master/monitor
技巧:在微信的辅助功能里面启用QQ邮箱提醒的功能,那么股价变动的通知就会很及时了,因为微信几乎等同于短信了。
这里简单说一下各个配置项及使用方法。
default段落
breakthrough代表突破的比例,需要传入两个值,项目里面的突破比例依次是3%,5%.
withdraw代表回撤,也需要两个值,示例为3%,5%.
attention代表关注的股票列表,填入关注的股票代码,用空格隔开
注:这里暂时没有考虑关注股票的情况,所以很多的关注股票也许有性能上的问题。
mail段落
依次输入用户名及密码以及收件人的邮箱
position段落
当前持仓的股票以及其持仓成本。
如持有京东方A(000725)以5.76的股价。
000725 = 5.76
如果多个持仓就多个如上的相应的键值对。
使用方法参考该脚本的readme
https://github.com/youerning/UserPyScript/blob/master/monitor/README.md
==PS:很难过的是英文水平不好还用因为注释,以及用英文词汇做变量名,如果词不达意请见谅。==
下单
这一部分本人暂时没有让程序自动执行,因为暂时还没有打磨出来一套适合自己并相信的体系,所以依靠股价监控的通知,根据不断修正的体系在手动执行交易。
后记
自从用了自己编写的系统,每月都实现了稳定盈利,仅仅3个月老鸟就赚了320万。
最后以下图结束.

最后的最后:
争取尽快实现一个亿的小目标
如果以上内容对您有帮助,请老板用微信扫一下赞赏码,赞赏后加微信号 birdpython 领取免费视频。


最好的途径 ,是开发软件卖钱

要发明轮子的节奏

如果所有股民都学会了你所说的科学炒股,那么去赚谁的钱呢

到现在还有多少人认为股票是基于数学规律的,这应该是个不错的研究课题。

可以指条明路吗?:如何从接口爬的?我断断续续学了一年余python,就是想每天抓个成交量之类的数据并自动弄成表(懒)。但是至今还没入门[捂脸]还没写过一个小项目[捂脸]

这在中国是行不通的啊…

巴菲特炒A股都栽了,A股不是那么简单的!

程序员炒股,总感觉怪怪的

炒股更多的是人心,博主这方面模型能否详细讲一下,模拟涨跌时的各种交易操作,庄家怎么操作,散户怎么操作,这些都是可以量化的。说了这么多,其实我没炒过股,哈哈哈哈哈哈。

现在正在优化这方面的模型

使用高性能设备和代码炒股无异于杀鸡用牛刀,还不一定宰的掉,量化交易的主流方向是套利,高频交易,炒股软件自带根据财务数据,技术指标选股。

卧槽 表示惊呆了 但是我觉着你的低价位金叉和高价位死叉的算法有点问题 低价位和高价位都是相对于这一次上涨和下跌过程中的 相对高价和低价 个人感觉 应该这样来算吧

其实我也是这样理解的,所以很多指标要结合起来看,不能但看一个

兄弟 炒股?

我是一个应届研究生,目前待业,正在学python基础,很迷茫,你说我是割腕呢还是上吊呢?

博主,能否给做一个交易系统,价钱好商量,尽快回复我好吗。

炒股是概率上的艺术,大盘跌他涨实际上得出的结论是有资金在炒作,并不能说明更好